Google Chart
Parameters
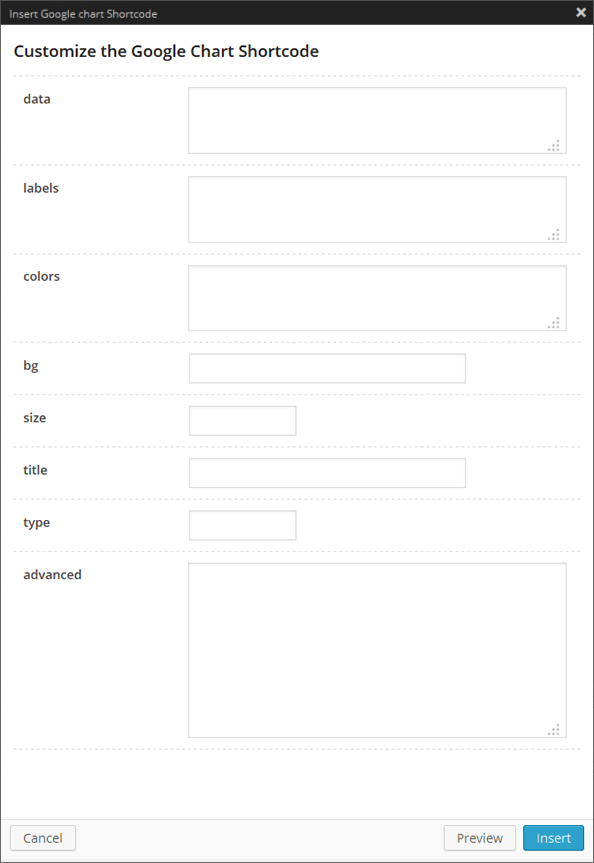
- data the chart data
- labels the chart labels
- colors the chart colors
- bg the chart background
- size the chart size
- title the chart title
- type the chart type
- advanced the chart advanced option
Shortcode Option Panel
3D Pie Chart
[chart data=”70,25,20.01,4.99″ labels=”Reffering+sites|Google|Yahoo|Other” colors=”058DC7,50B432,ED561B,EDEF00″ bg=”bg,s,ffffff” size=”630×250″ title=”3D Pie Chart Title” type=”pie”]Get the code
[chart data="70,25,20.01,4.99" labels="Reffering+sites|Google|Yahoo|Other" colors="058DC7,50B432,ED561B,EDEF00" bg="bg,s,ffffff" size="630x250" title="3D Pie Chart Title" type="pie"]Line Chart
[chart data=”70,25,20.01,4.99″ labels=”2010|2011|2012|2013″ colors=”058DC7,50B432,ED561B,EDEF00″ bg=”bg,s,ffffff” size=”630×250″ title=”Line Chart Title” type=”line”]Get the code
[chart data="70,25,20.01,4.99" labels="2010|2011|2012|2013" colors="058DC7,50B432,ED561B,EDEF00" bg="bg,s,ffffff" size="630x250" title="Line Chart Title" type="line"]Get the code
[chart data="0,25,50,75,100|2,33,43,17,25|0,25,50,75,100|0,20,25,40,75" labels="Begin|25|50|75|End" colors="058DC7,50B432" bg="bg,s,ffffff" size="630x250" title="Line Chart Title 2" type="xyline"]Scatter Chart
[chartdata=”0,10,20,30,40,50,60,70,80,90,100|50,52,56,63,70,80,92,85,75,60,43″ labels=”1|2|3|4|5|6|7|8|9|10″ colors=”058DC7″ bg=”bg,s,ffffff” size=”630×250″ title=”Scatter Chart Title” type=”scatter”]
Get the code
[chart data="0,10,20,30,40,50,60,70,80,90,100|50,52,56,63,70,80,92,85,75,60,43" labels="1|2|3|4|5|6|7|8|9|10" colors="058DC7" bg="bg,s,ffffff" size="630x250" title="Scatter Chart Title" type="scatter"]Pie Chart
[chart data=”70,25,20.01,4.99″ labels=”Reffering+sites|Google|Yahoo|Other” colors=”058DC7,50B432,ED561B,EDEF00″ bg=”bg,s,ffffff” size=”630×250″ title=”Pie Chart Title” type=”pie2d”]Get the code
[chart data="70,25,20.01,4.99" labels="Reffering+sites|Google|Yahoo|Other" colors="058DC7,50B432,ED561B,EDEF00" bg="bg,s,ffffff" size="630x250" title="Pie Chart Title" type="pie2d"]Gom Chart
[chart data=”40″ labels=”Forty” colors=”058DC7,50B432,ED561B,EDEF00″ bg=”bg,s,F7F9FA” size=”630×250″ title=”Gom Chart Title” type=”gom”]Get the code
[chart data="40" labels="Forty" colors="058DC7,50B432,ED561B,EDEF00" bg="bg,s,F7F9FA" size="630x250" title="Gom Chart Title" type="gom"]Venn Chart
[chart data=”100,80,60,30,30,30,10″ colors=”FF6342,ADDE63,63C6DE” bg=”bg,s,F7F9FA” size=”630×250″ title=”Venn Chart Title” advanced=”&chdl=A|B|C” type=”venn”]Get the code
[chart data="100,80,60,30,30,30,10" colors="FF6342,ADDE63,63C6DE" bg="bg,s,F7F9FA" size="630x250" title="Venn Chart Title" advanced="&chdl=A|B|C" type="venn"]Learn more from http://code.google.com/apis/chart/


